
Remember expensive energy? It may return as a thing. . .
This chart complied by Michael Sivak of Sivak Applied Research clearly shows how bad things were last April—and one takeaway should be to note how quickly things can go south: we may think that major changes take a slow walk, but that’s clearly not the case.
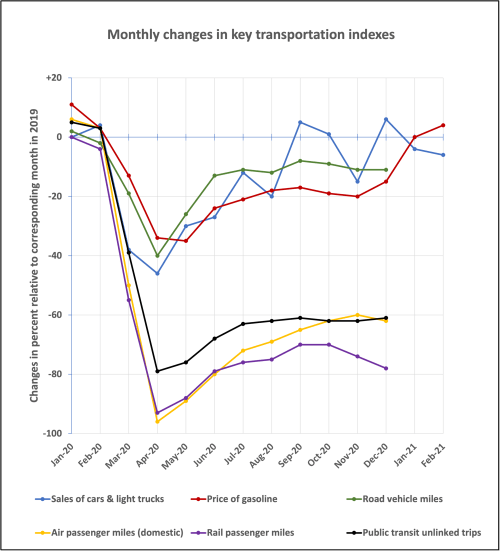
While there are improvements at the top of the chart, it is clear that modes of mass transportation (or at least transportation that takes more than a few people at a time, as air travel is not necessarily something everyone can afford, even if they’re opting for an airline that charges for every conceivable thing), are still languishing.
One thing that caught my eye is that red line: Gas prices. Note how there is an inexorable increase.
According to the Energy Information Agency, on March 8 the average price of regular in the U.S. was $2.771.
That is up $0.396 from a year ago.
While that is not a huge rise, take that increase, add in the dynamic of Sivak’s chart, and know that last week OPEC+ decided that it would keep a voluntary cut in oil output until at least April, and realize that the ever-rising sales numbers of pickups and full-size SUVs may resemble the left side of Sivak’s chart.
